The key purpose of implementing of oneTMS is to obtain reliable, accurate and real time operation data. Due to unique oneTMS design data is “mined” and “co-owned” by multiple parties in the transport chain. Shipment content & SLA data is generated & belongs to shipper, freight rate data is co-generated by both them and carriers while pickup & delivery performance is generated by carriers and drivers. Everyone benefits but what to do with all this data then?

oneTMS provides various ways to interact with your data.
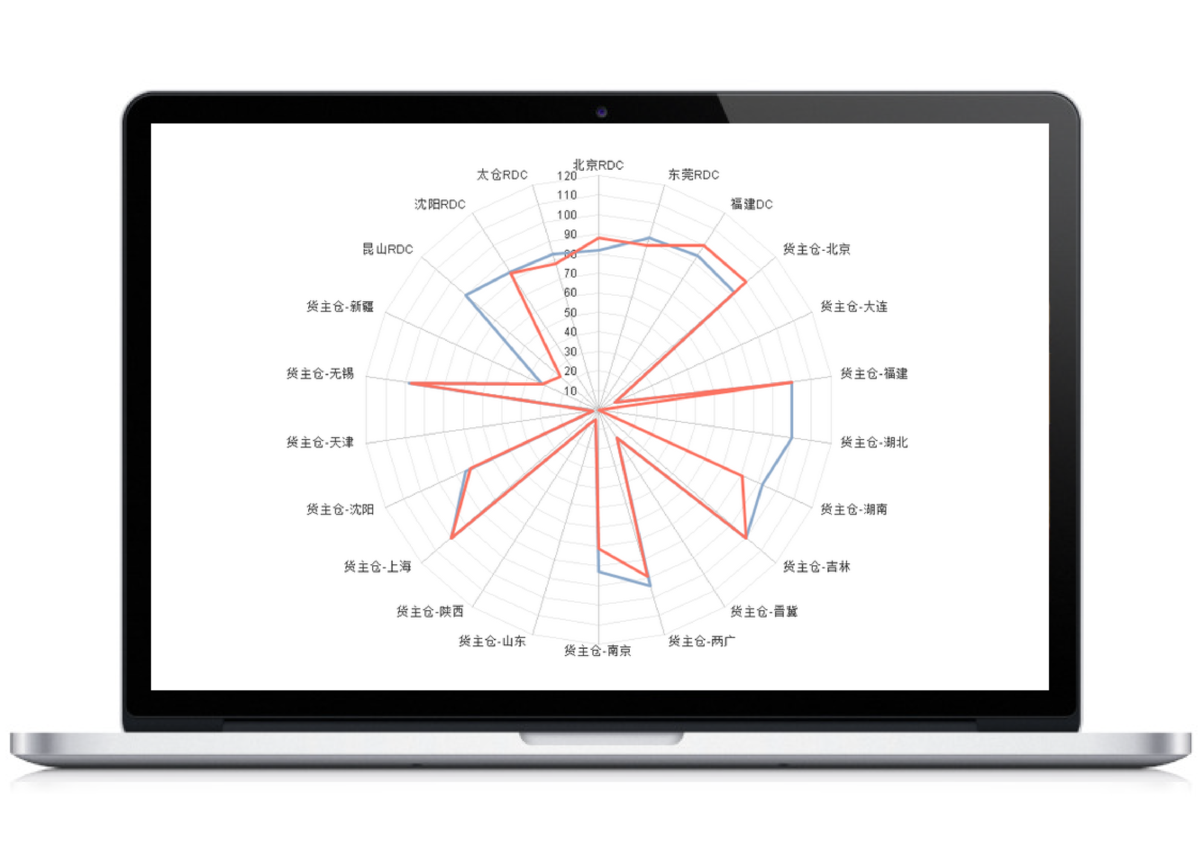
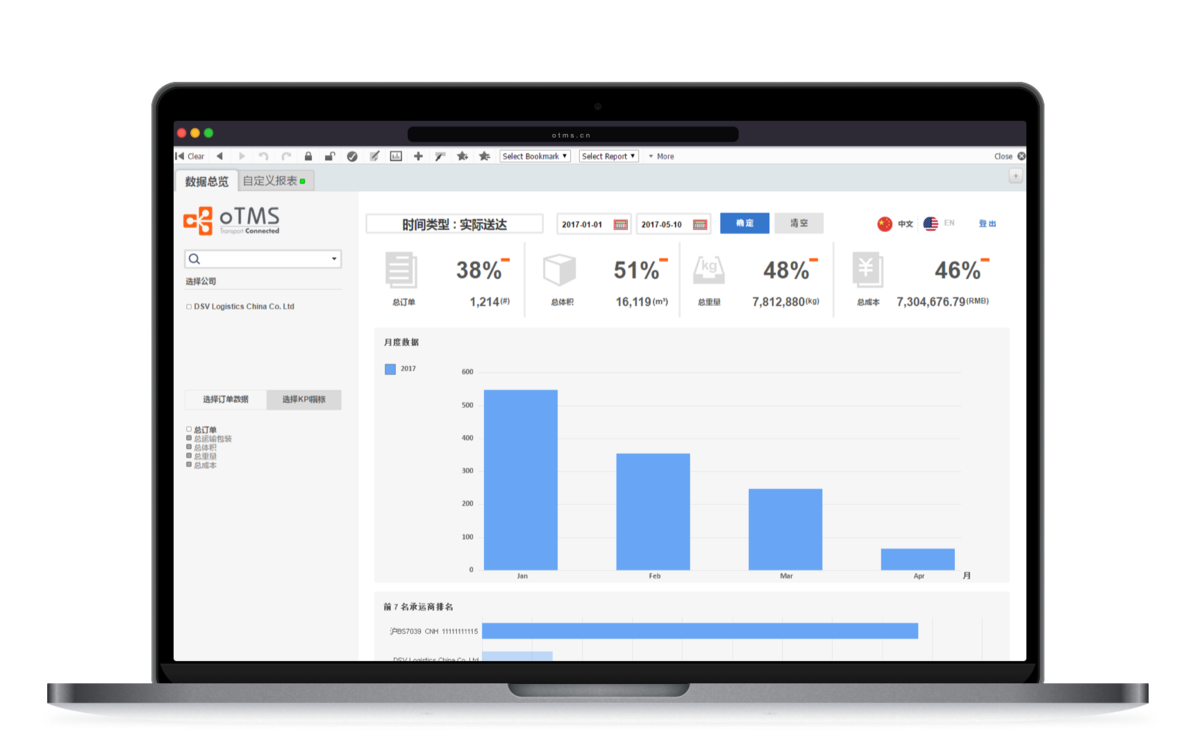
On basic level there are standard, free dashboard with reports and beautiful charts – including detailed maps of China where you can see most common transport reports. These reports are configured to be pushed to various users and non-users (management/peers). Most importantly, you finally have a common language with your carriers – at no effort & time-consuming development of monthly or even quarterly XLS reports
On advanced level oneTMS provides highly customizable reports using Qlikview – one of global leaders in BI, as per Gartner Magic Quadrant research. Our BI analysts can develop unique reports made for you.
Finally, power users in large enterprises with own BI tools can integrate oneTMS data directly into their platform via oTMS powerful data APIs.

What gets measured gets improved. All data and reports are meaningless without improvements.
Standard dashboards are designed to provide a drill-down to shipment level in order to see and fix root causes of non-compliance when possible.
oneTMS technology is evolving rapidly – bots, algorithms and even AI are coming not only to automate routine tasks but to assist you to make right decisions.
This is a power of cloud – oneTMS as SaaS solution you don’t need to upgrade and pay extra to take advantage of data and analytics.
With oTMS professional transport team – you can also ask us to help you manage your transport better – this is a power of Orange.